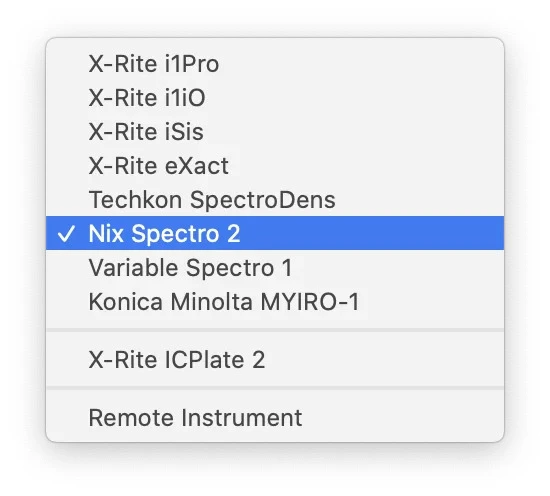
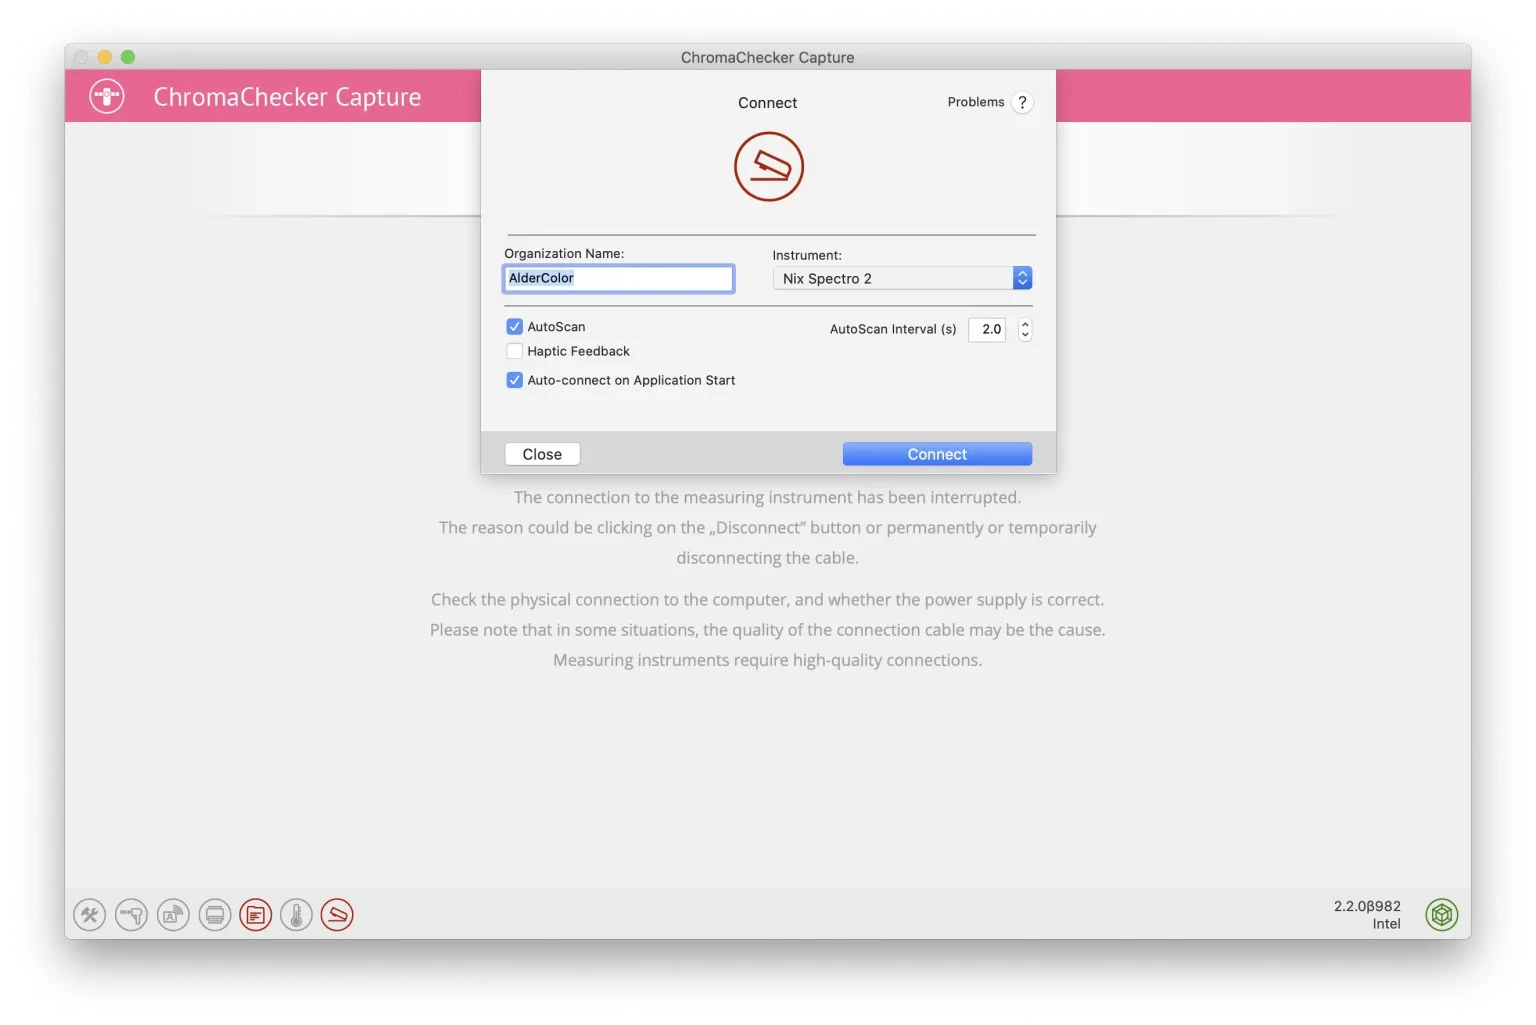
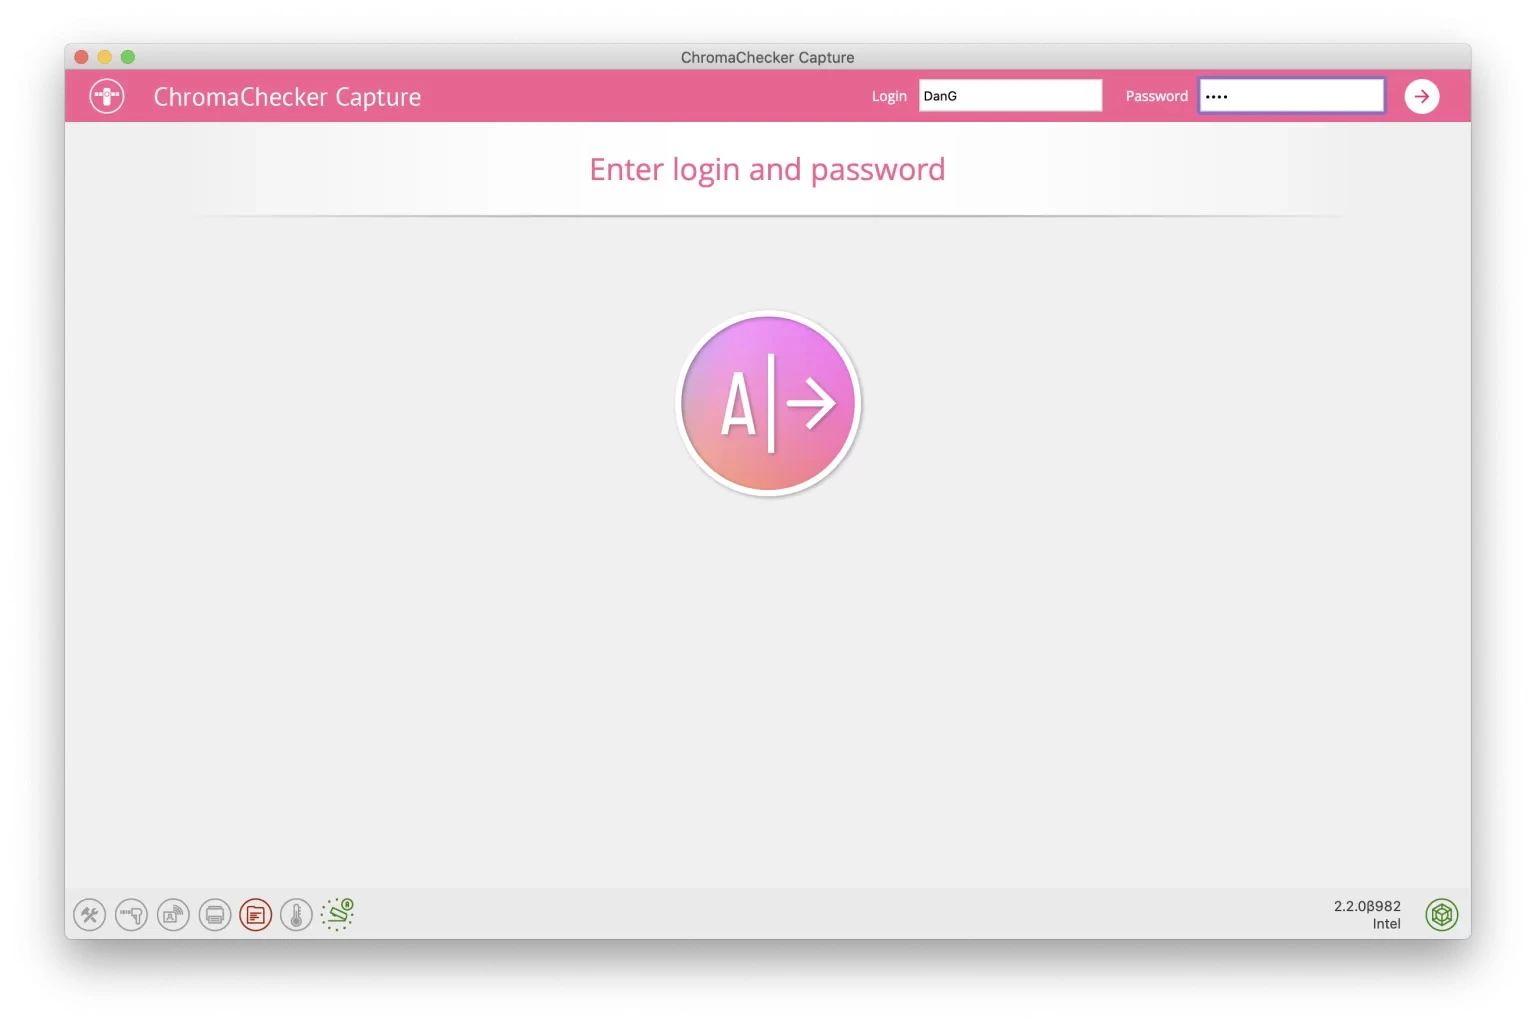
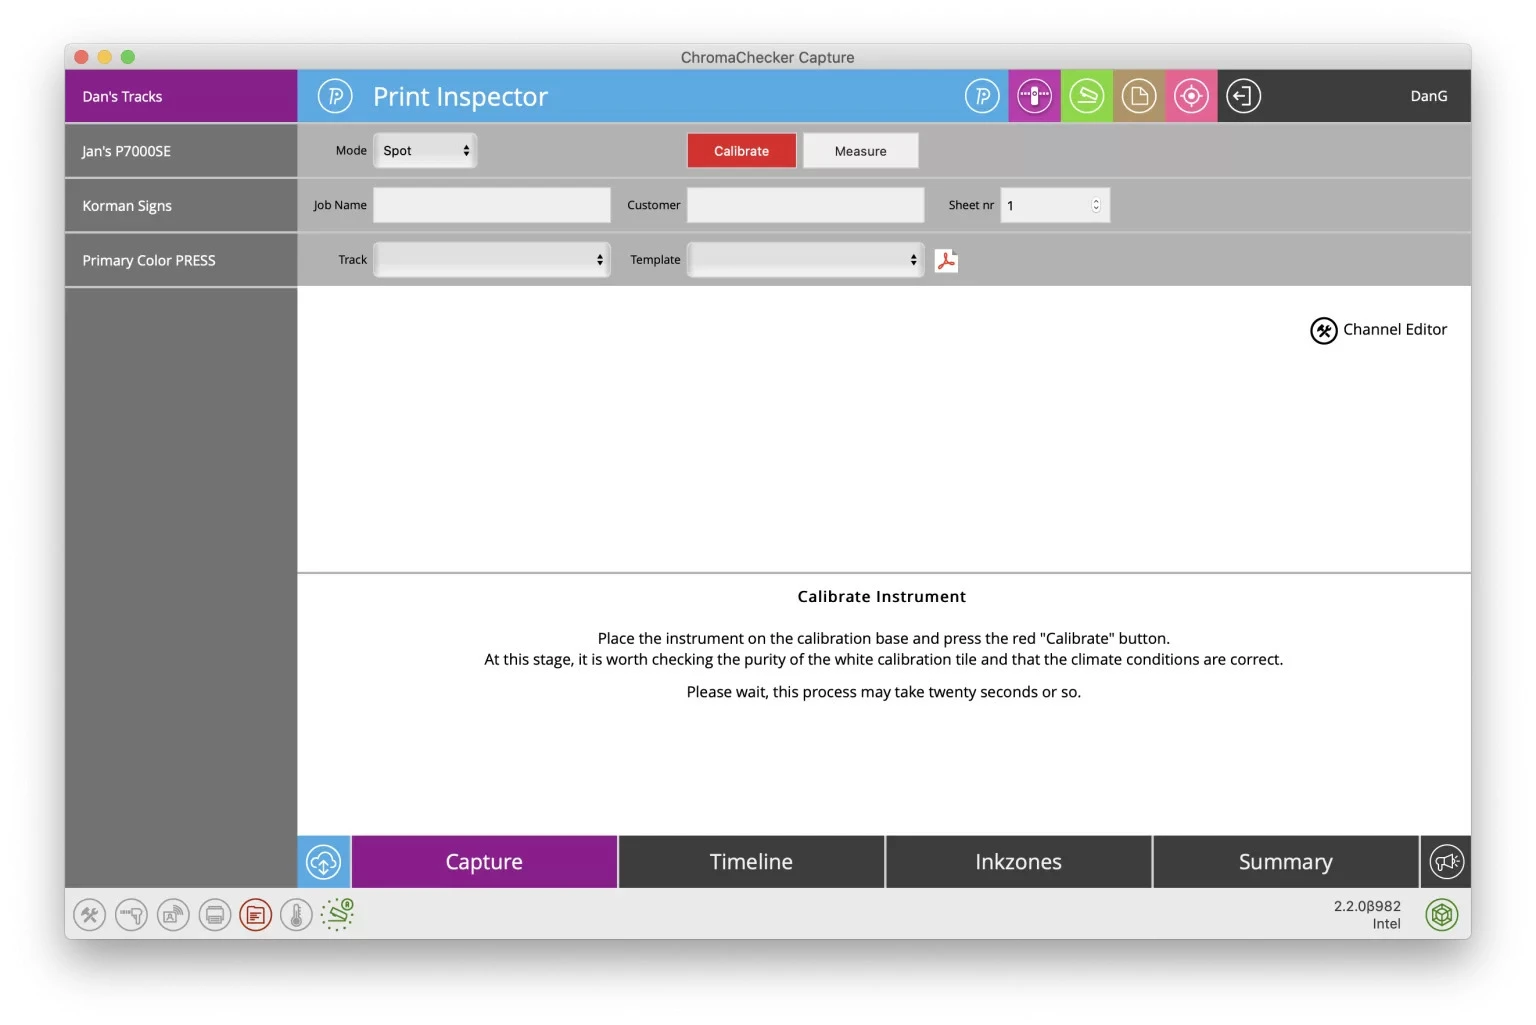
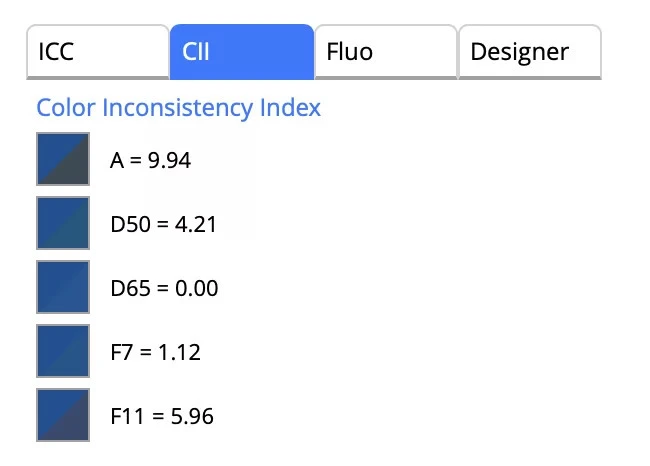
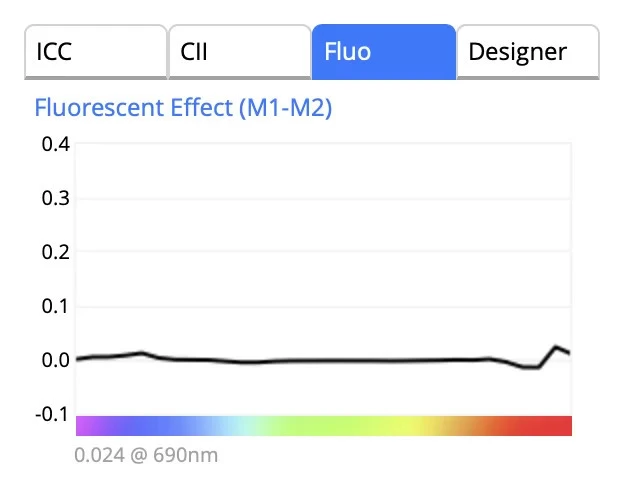
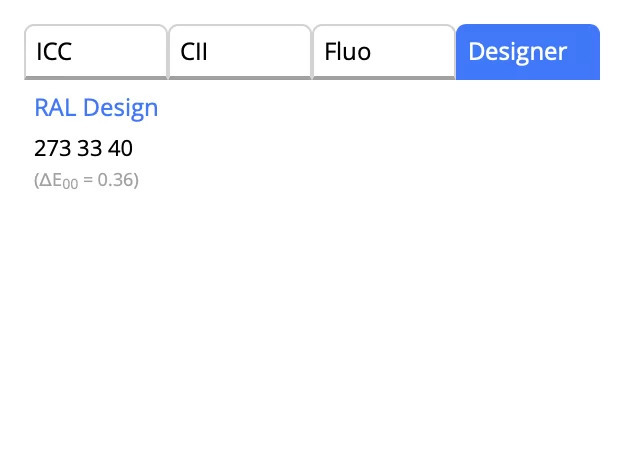
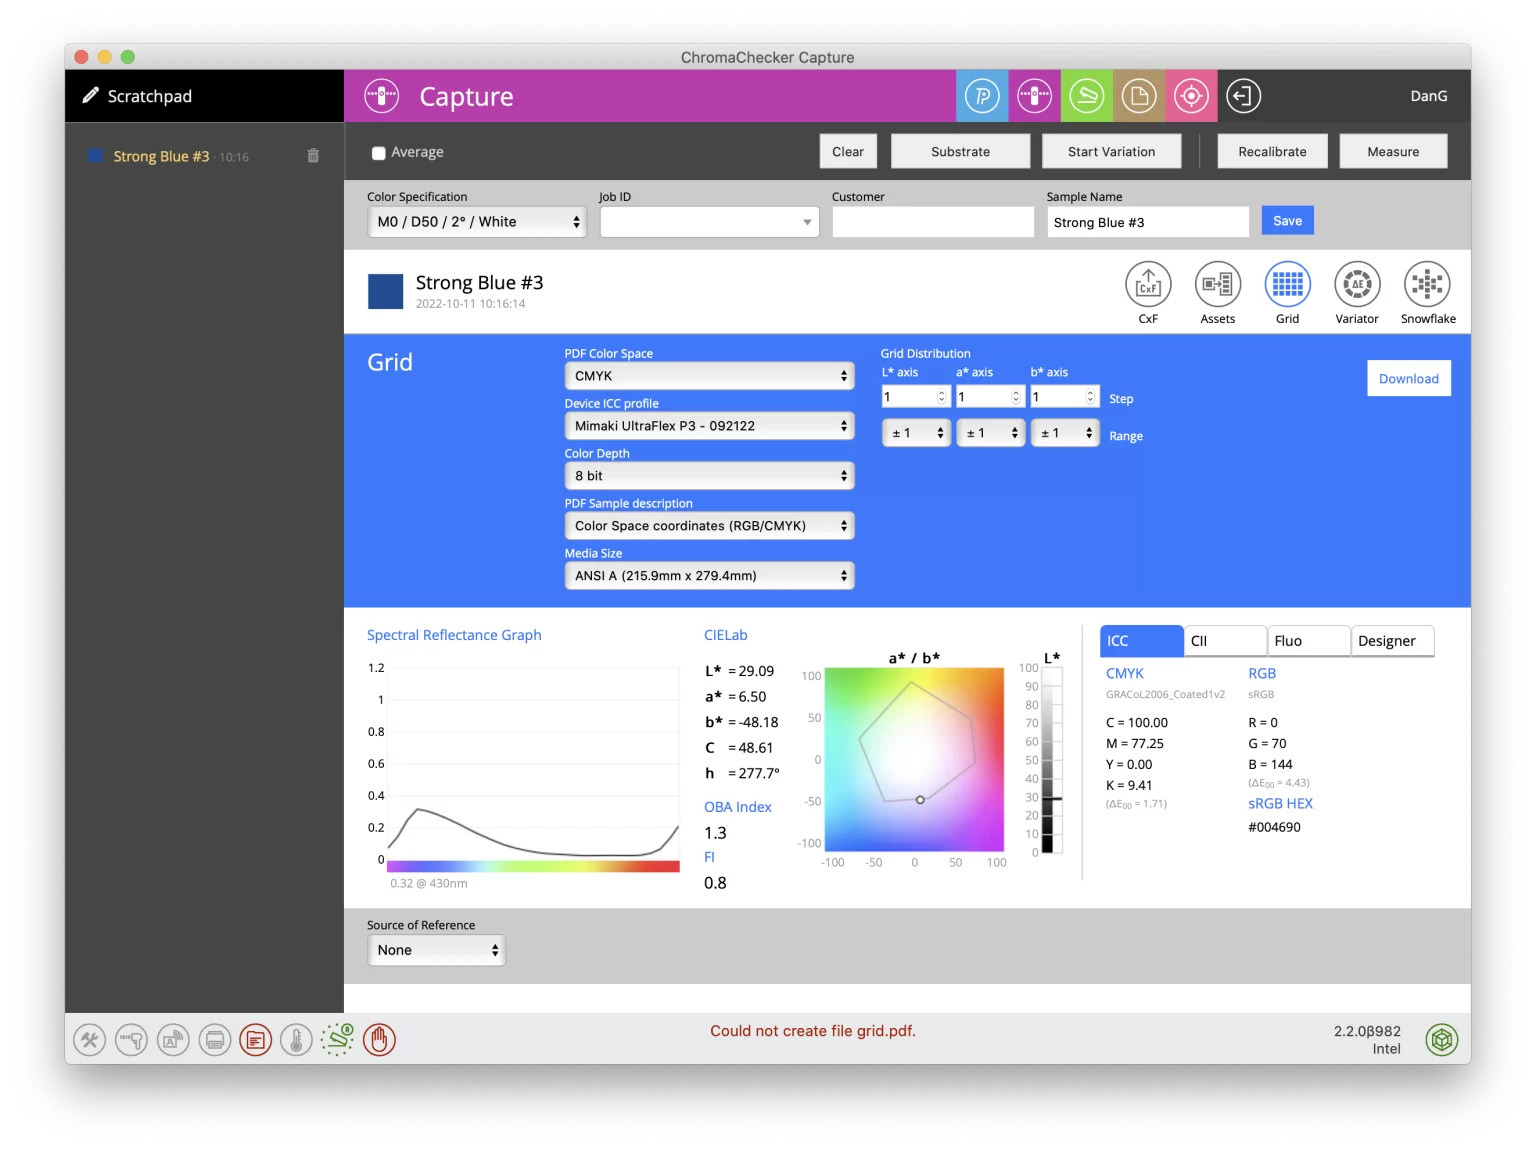
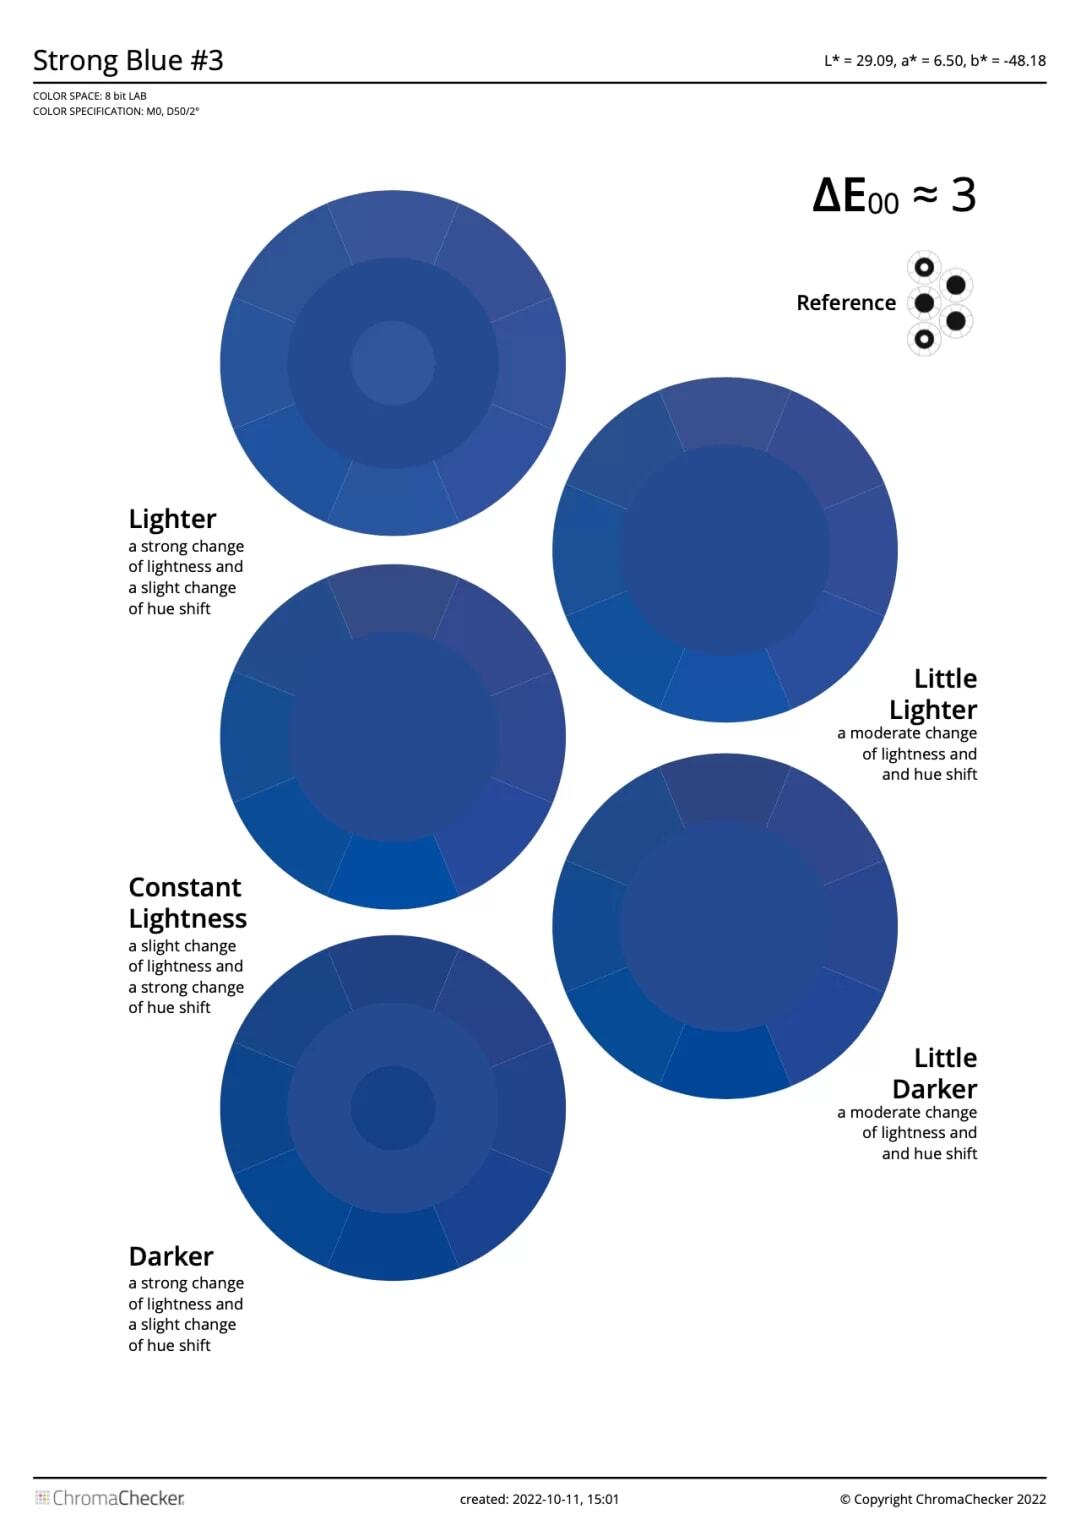
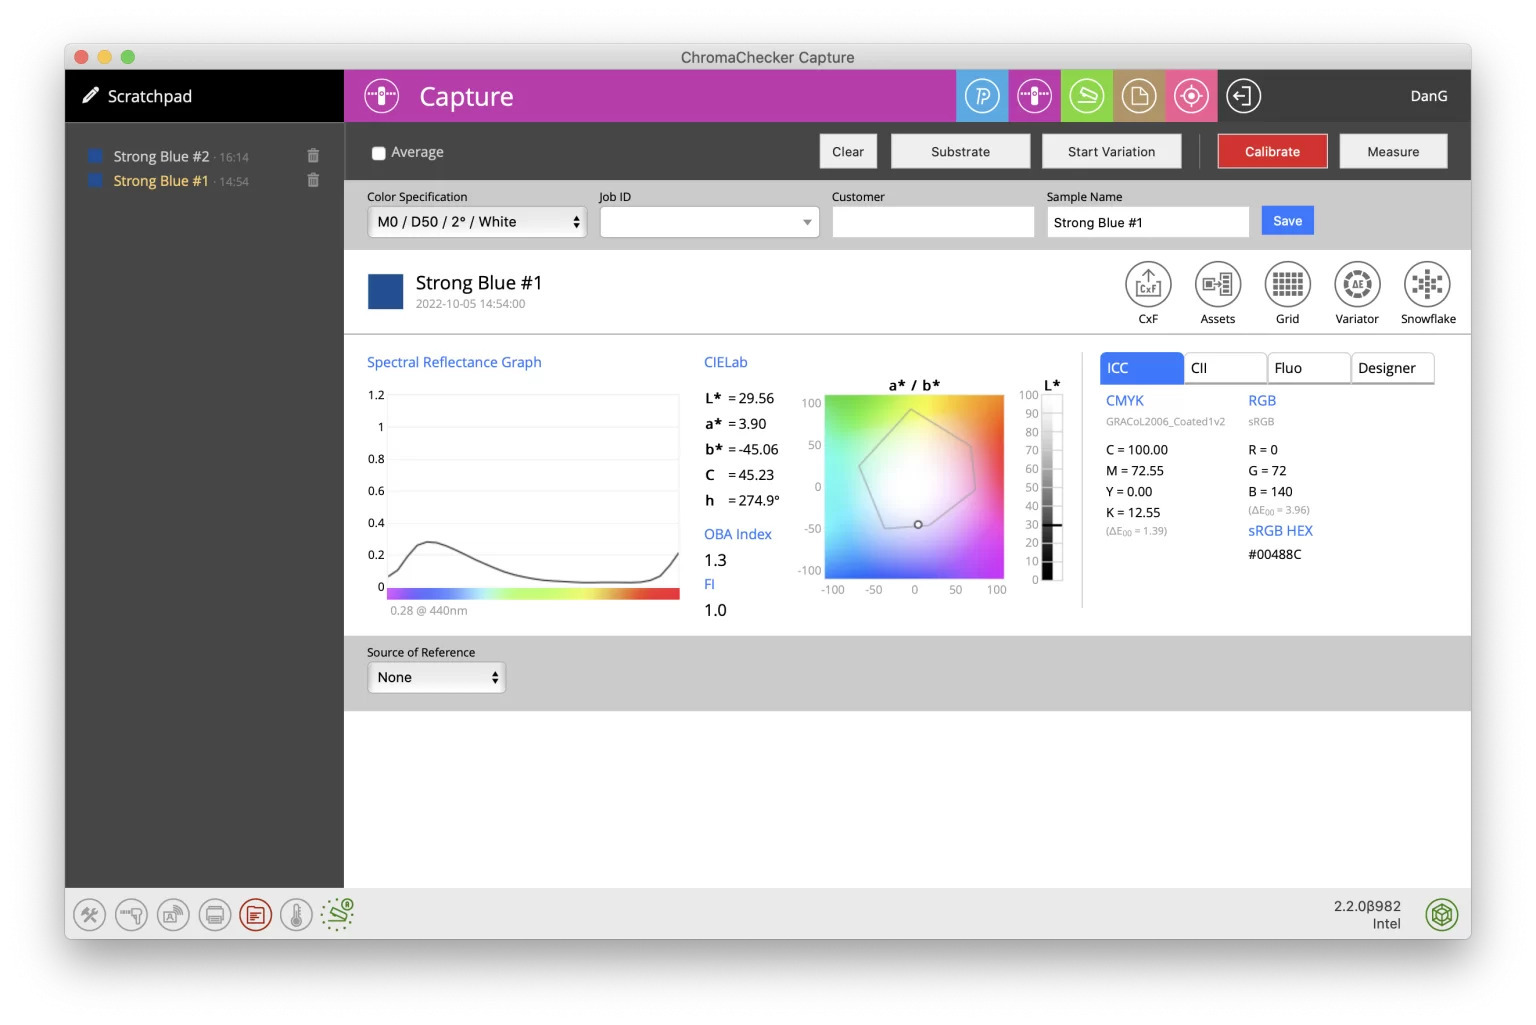
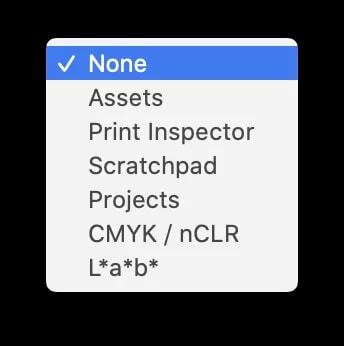
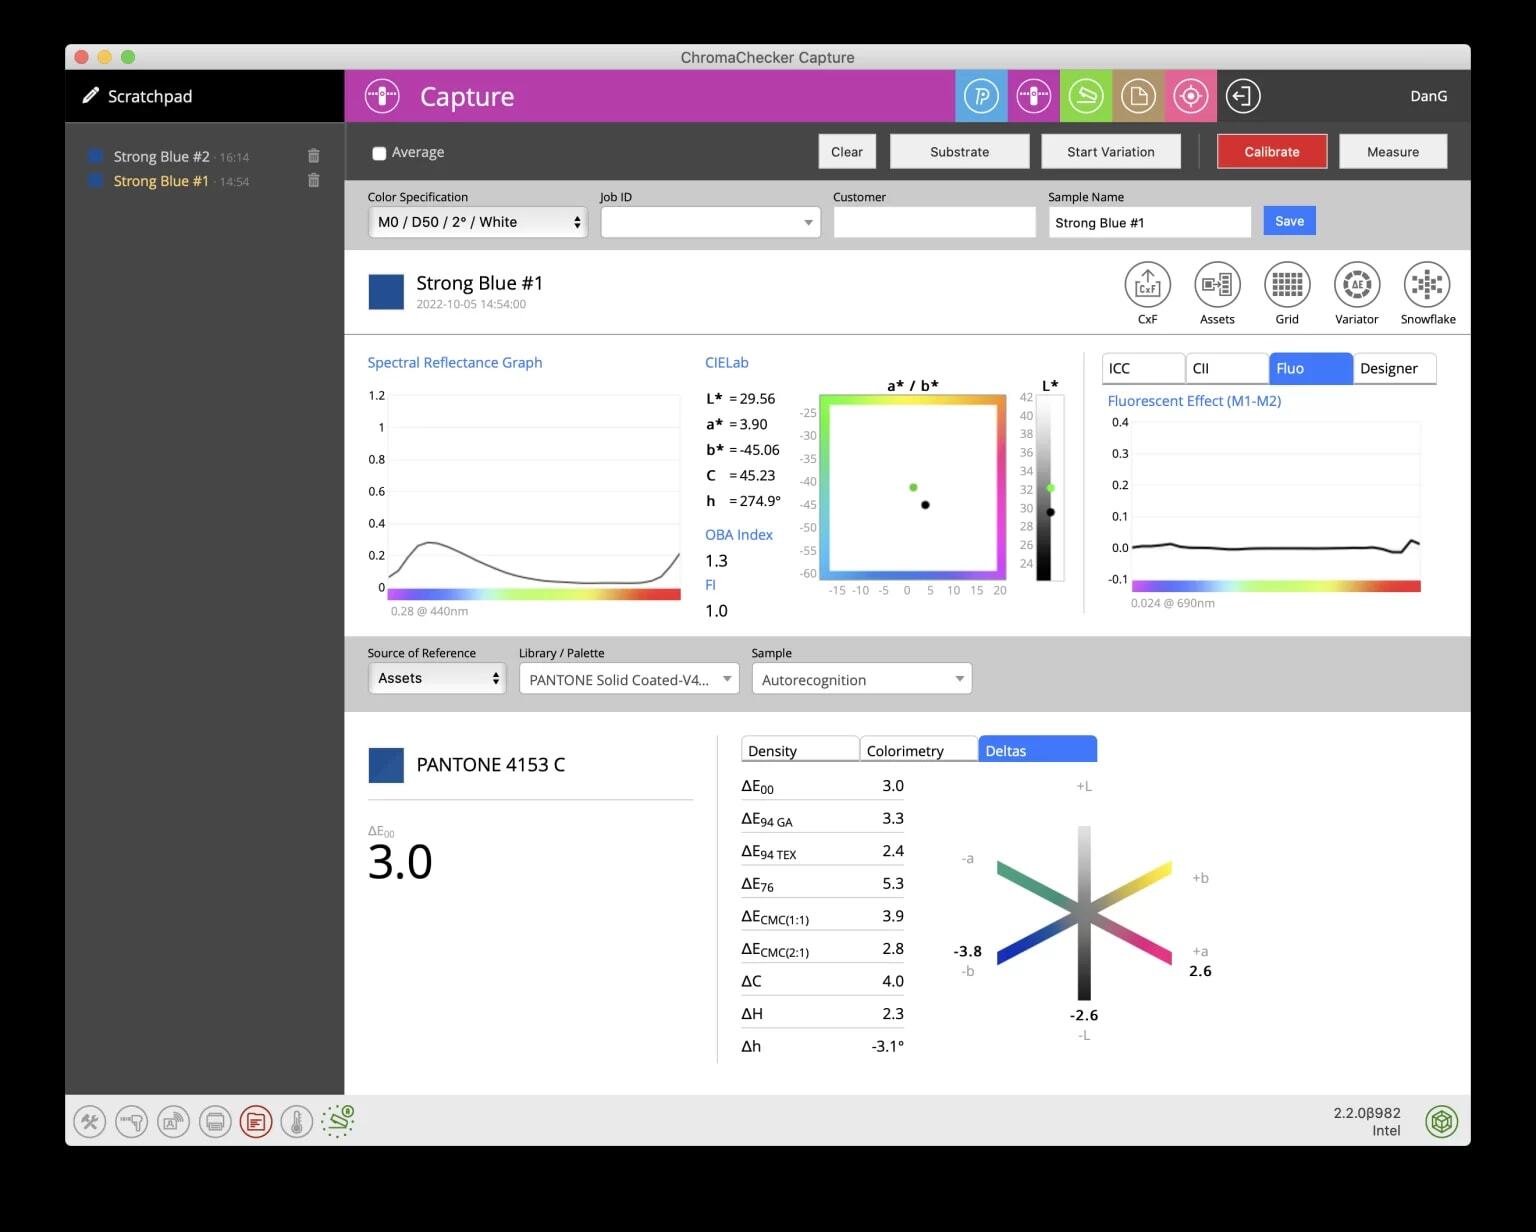
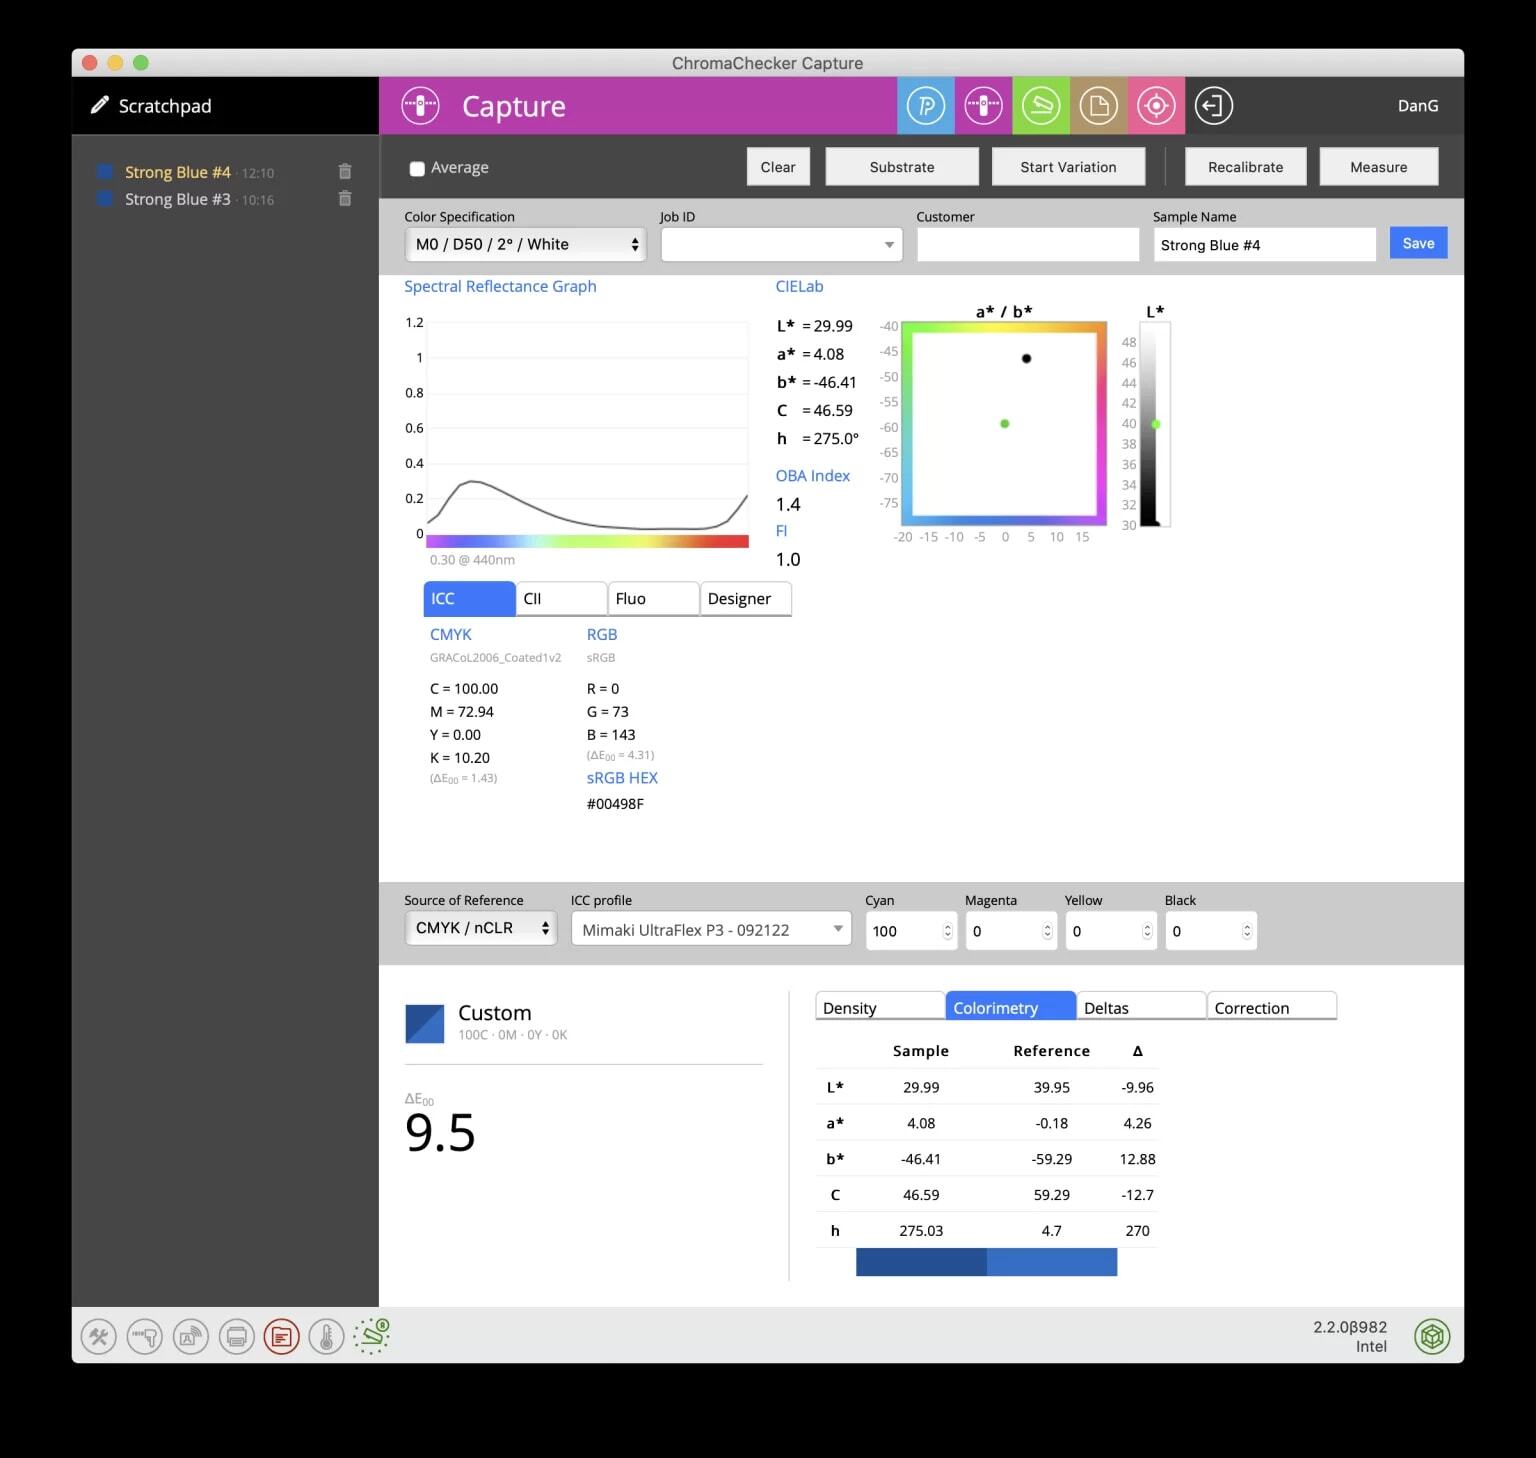
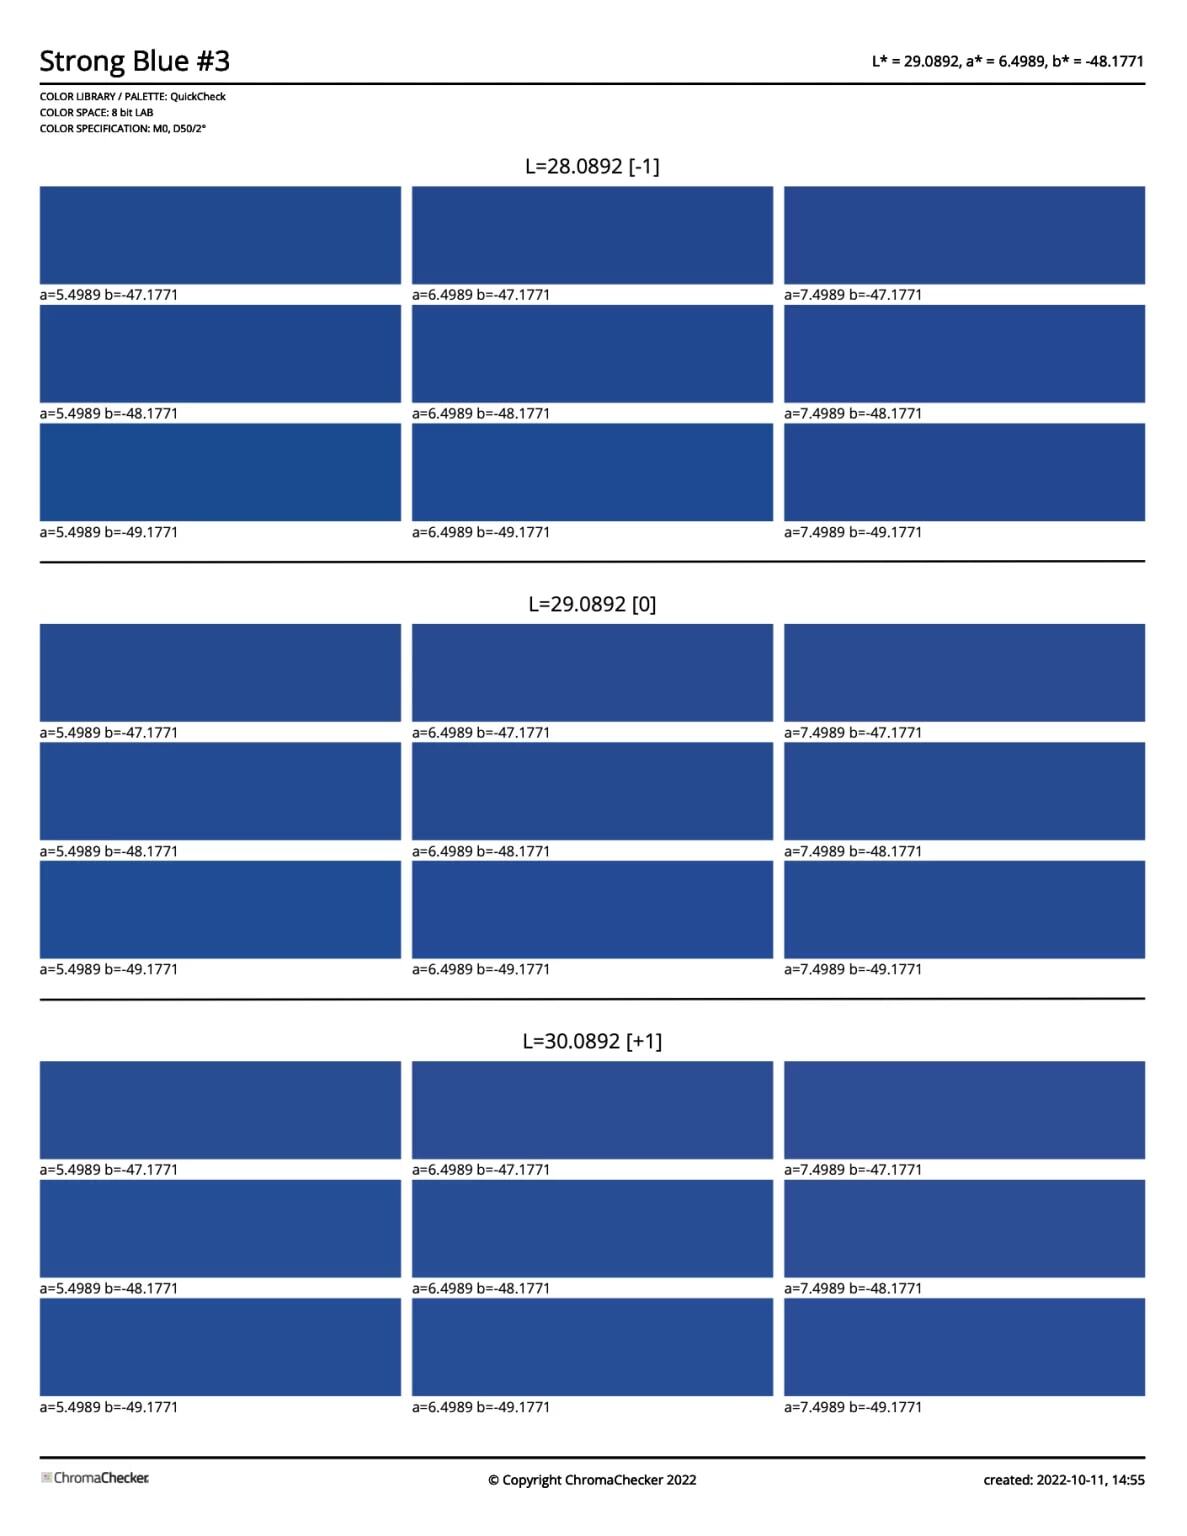
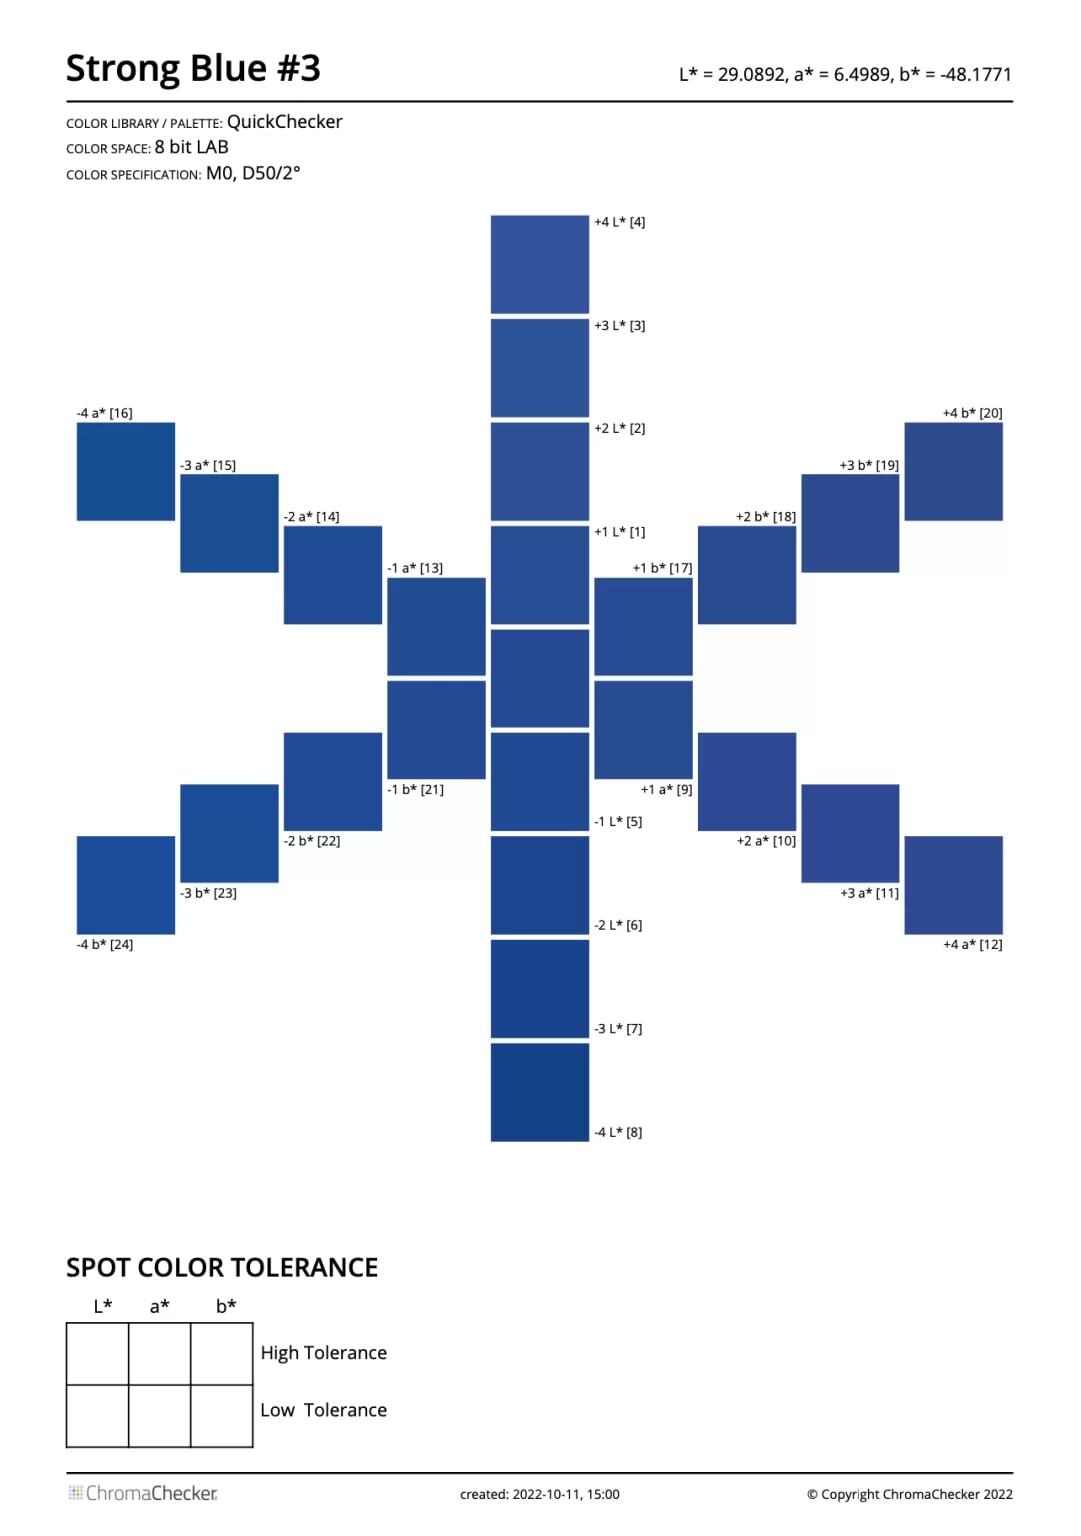
I want to turn you on to a very powerful, easy-to-use, and inexpensive solution for a very common problem: defining, reproducing, and comparing spot colors. You'd think there would be tons of options for everything ChromaChecker Capture can do — but that's not the case. Most people dealing with spot colors use a color measurement device (spectrophotometer) with a screen and computer built in. The most popular are the X-Rite eXact (by far) and the Techkon SpectroDens. These are expensive — generally in the $8,000–$12,000 range. When you buy a far less expensive device without a built-in screen and computer, you connect it to a computer running supported software. The most popular device here is the i1 Pro 2/3/3-Plus, generally $1,500–$2,000+. The software bundled with that instrument isn't full-featured for spot color — mainly, in my opinion, because X-Rite would rather push customers toward the much more expensive devices. But there are multiple less-expensive instruments that are comparably accurate, precise, and repeatable — including the Nix Spectro 2 and the X-Rite i1 Pro 3. (The Konica Minolta MYIRO-1 also lived in this space; note that Konica Minolta ended production of the MYIRO line at the end of 2025, though existing units remain supported for several years.) These instruments just need good software to be as good — if not better — solutions. That's what I'm going to illustrate. Designers need to define colors, save those measurements, create palettes to import into design apps, share those definitions with anyone in the supply chain, and use them for QC. Printers need to quickly determine their specific capabilities in matching any given color on any given printer/ink/media combination — and to what degree of accuracy (Delta E). Capture calculates the Delta E and provides the exact CMYK recipe to match any measured color or LAB value, based on its ICC media profile. The vast majority of printing companies don't know how to do this today. Most are printing variations of each color on each printer and visually trying to evaluate the match — not knowing whether they have any chance of matching the color at all. That's extremely inefficient and costly. Let's look at everything Capture can do, starting with measuring individual colors — whether you're a designer defining a new palette or a prepress/pressroom person measuring against a target for QC. When you first launch ChromaChecker Capture, you'll be prompted to log into your account on ChromaChecker.com (or a private branded instance like our alder.chromachecker.com). You then choose which connected spectrophotometer you have — ChromaChecker supports many. When the interface comes up, it may default to the Print Inspector. Click the purple icon next to Print Inspector across the top to switch to Capture (QuickChecker). Now you're ready to measure. Click Calibrate, place the device on the color you want to measure, and either press the button on the device or click Measure in the software. Capture automatically gives your measurement a sample name (here, "Strong Blue #1"), which you can change and save into your Scratchpad on the left. Capture shows you the spectral curve (the true definition of the color, shown here in M0/D50/2°/White), plus CIELab, LCH, a 2-D gamut plot, CMYK values (based on GRACoL Coated, but changeable), RGB values (based on sRGB, also changeable), and HEX. From here you can click CxF to save the spectral definition as a Color Exchange Format file, or Assets to add it to the ChromaChecker cloud (requires the Color Inspector license). Click CII to see the Color Inconsistency Index for different lighting conditions. Click Fluo to see the Fluorescent Effect (M1–M2). Click Designer to see RAL values for paint, coatings, and plastics. Once you have the spectral definition of a color, you may need to reproduce (or try to match) it on a printing machine. You can generate a PDF Grid chart in L*a*b*, RGB, or CMYK color space, at 8-bit or 16-bit depth, with sample descriptions under each patch, in different media sizes. Under Grid Distribution, you can customize the amount and type of variation in each patch, then download and print the PDF. In the example below I chose CMYK, which presents a list of ICC profiles (I've uploaded a long list over time through the ChromaChecker ICC Profile Inspector). I chose a Mimaki JV33 profile using dye-sublimation inks on UltraFlex transfer paper, with CMYK descriptions under each patch. The resulting PDF Grid file looks like this: You can use the Variator to see what Delta E differences look like, visually. The resulting PDF looks like this: The Snowflake functionality lets you further fine-tune the match by distributing colors via L, a, b incrementally. And its resulting PDF: Capture makes comparing colors easy. Choose the target color from the Scratchpad, then choose what to compare it against from the Source of Reference dropdown — colors saved to your Assets (in the cloud), colors measured into the Print Inspector (generally process colors), the Scratchpad, a CMYK or nCLR ICC profile, or simply a typed L*a*b* value. In this example I'm finding the closest Pantone color: I chose Assets, then the Pantone library I'd previously uploaded. Capture uses Autorecognition by default to find the best match — here, Pantone 4153 C at 3.0 Delta E00. You also see the best density (if you measure the paper color), LabCH colorimetry for both sample and reference, and the Delta values. Here I've chosen CMYK/nCLR from the Source of Reference menu, which lets me choose an ICC profile. I picked a Mimaki JV33 using dye-sublimation inks on UltraFlex transfer paper, sublimated to a poplin fabric — because I want to see whether this device/process can match my spot color. As you can see, it clearly cannot match my Strong Blue #4 — it's off by 9.5 Delta E00. Do you or your employees have a quick, easy method for determining this? I'm betting you don't. ChromaChecker Capture is a unique, inexpensive, powerful yet easy-to-use solution to problems that nearly all designers and print manufacturers dealing with spot colors currently struggle with. Not only is there no comparable product — Capture is plugged into the entire ChromaChecker platform in the cloud, so you can share any of this data with anyone, anywhere, in real time. ChromaChecker also offers additional Inspectors (software modules) to grow into a full enterprise-level solution for process control and conformance across every aspect of print manufacturing — from automated monitor calibration to monitoring ink and water balance on an offset press. We at Alder Color Solutions are proud to be the chosen distributor for ChromaChecker, and we've spent years becoming experts so we can support design through production in communicating color accurately, efficiently, objectively, and digitally. If you'd like to talk it through, here's how to reach me directly. Director of Technical Services, Alder Color Solutions Dan has spent more than three decades helping printers, converters, publishers, packaging companies, and photographers get control of their color — across offset, flexo, wide-format, digital, and packaging production. He founded the color consultancy ColorGeek Inc. in 1999 and joined Alder in 2018. A certified G7 Expert since the inaugural 2006 class, he has spent nearly twenty years implementing G7 and international print standards in real production environments, and was one of the few certified instructors for the SGIA Digital Color Professional program. He's also a professional photographer — which keeps him fluent in both the artistic and technical sides of imaging.You Don't Need an $8,000 Instrument
What Designers and Printers Actually Need
Measuring Individual Colors
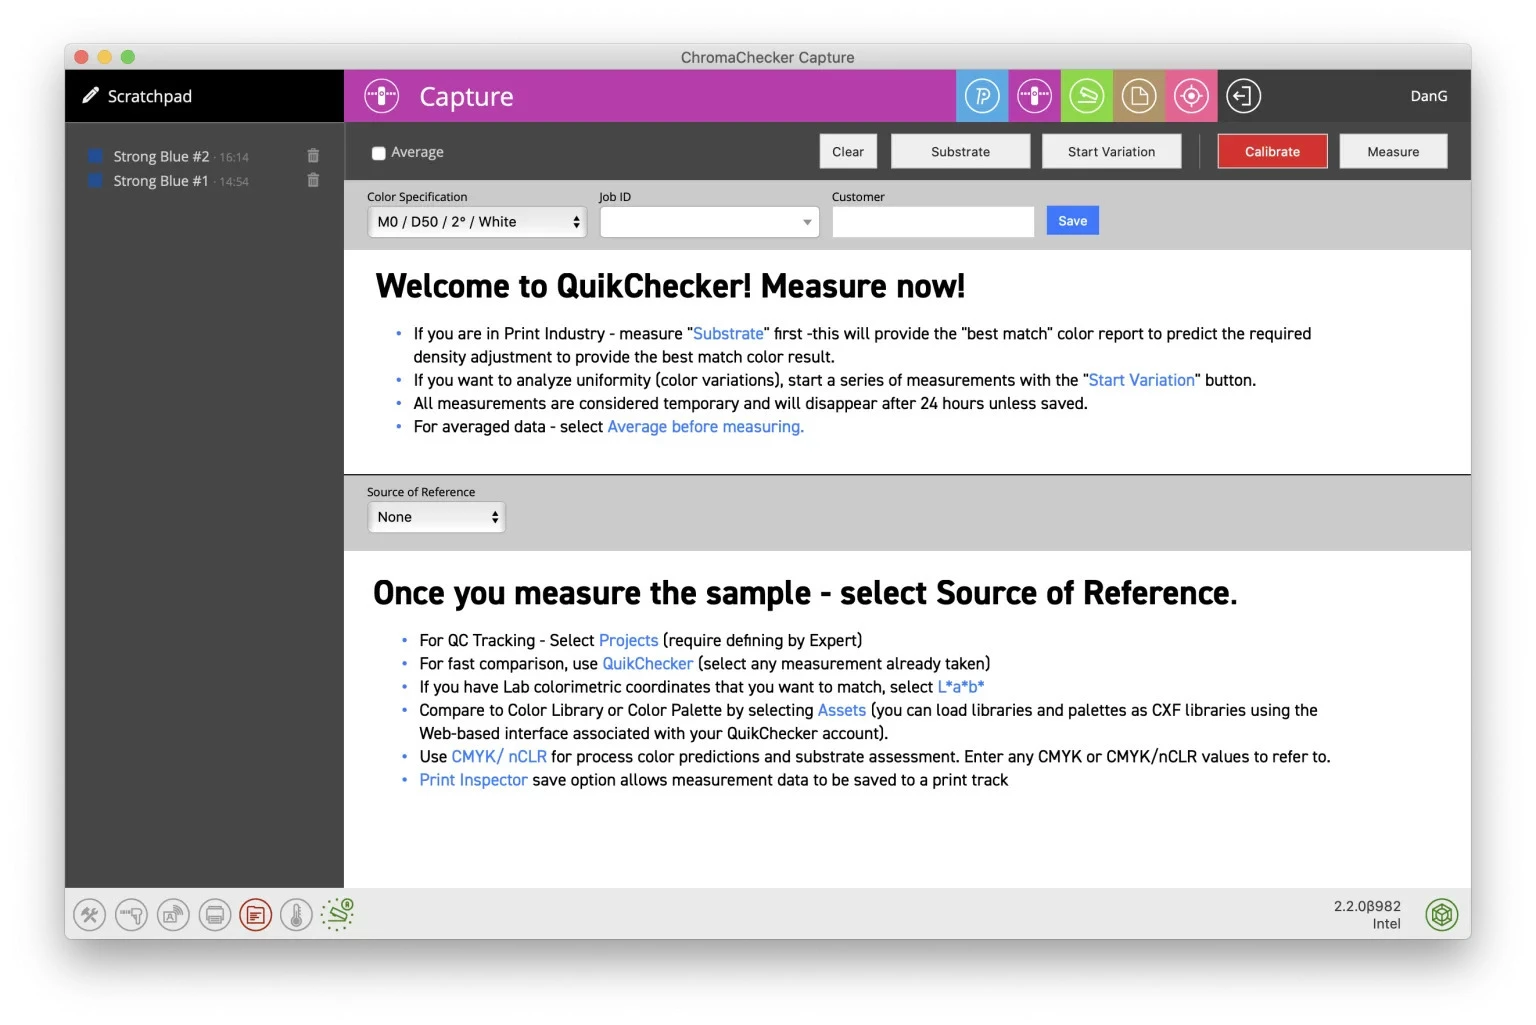
Reading the Color Details
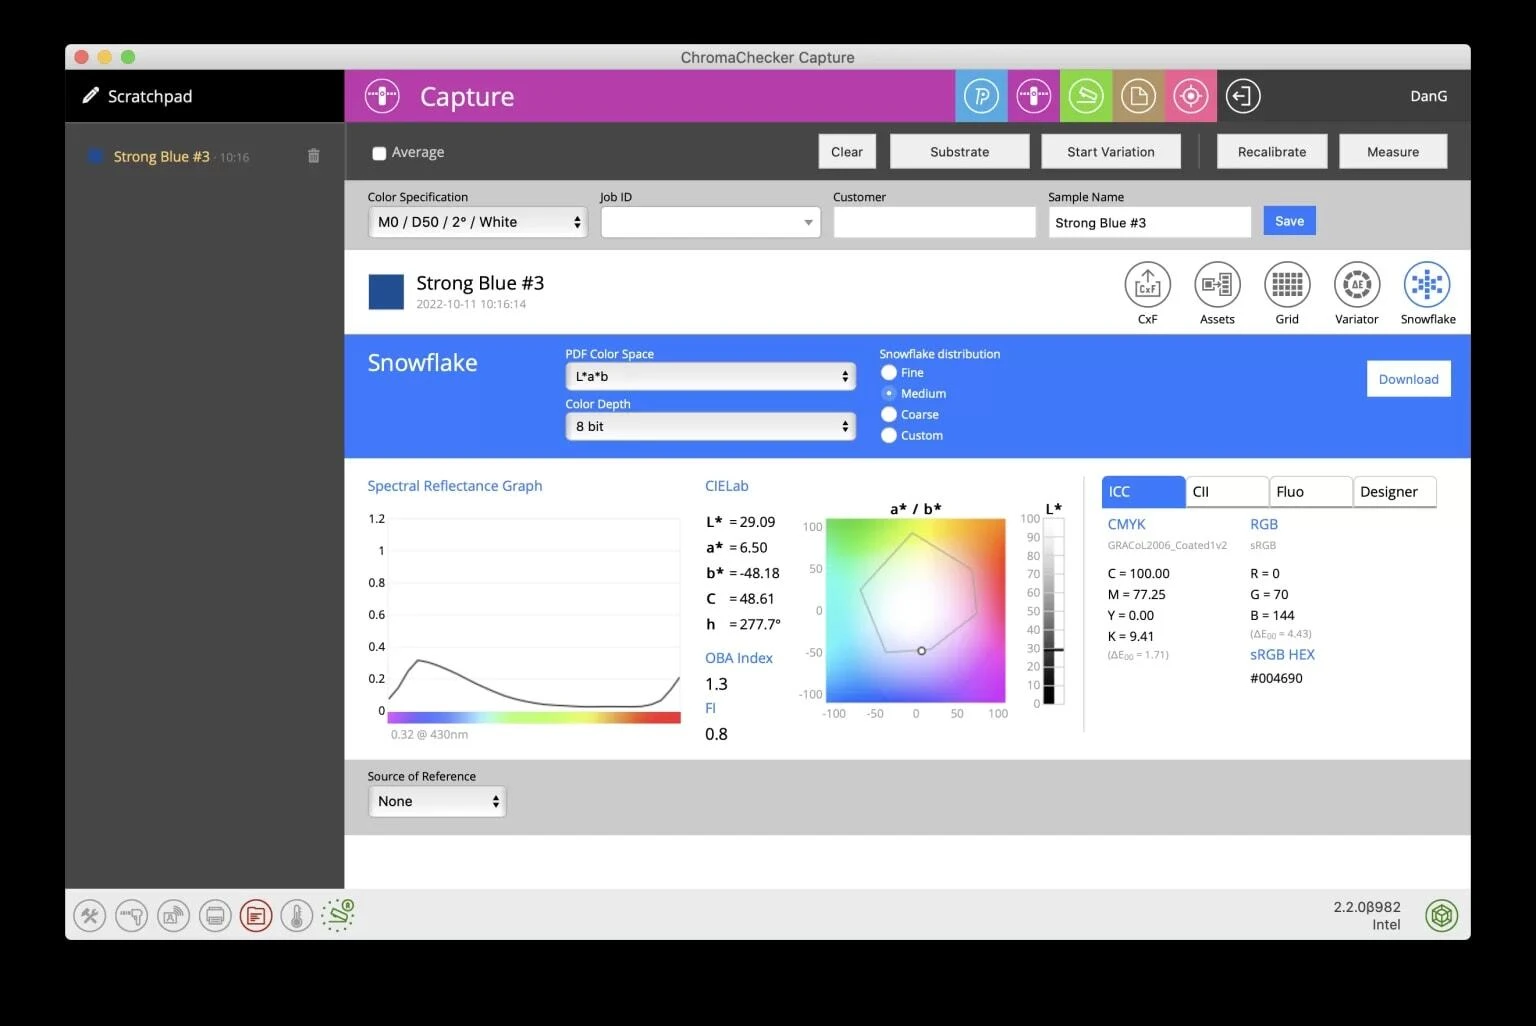
Reproducing and Visualizing Colors
Comparing Colors
The Bottom Line
Schedule a Consultation
Dan Gillespie — dang@aldertech.com — 717-475-9007About the Author

Dan Gillespie
Phone: 717-475-9007